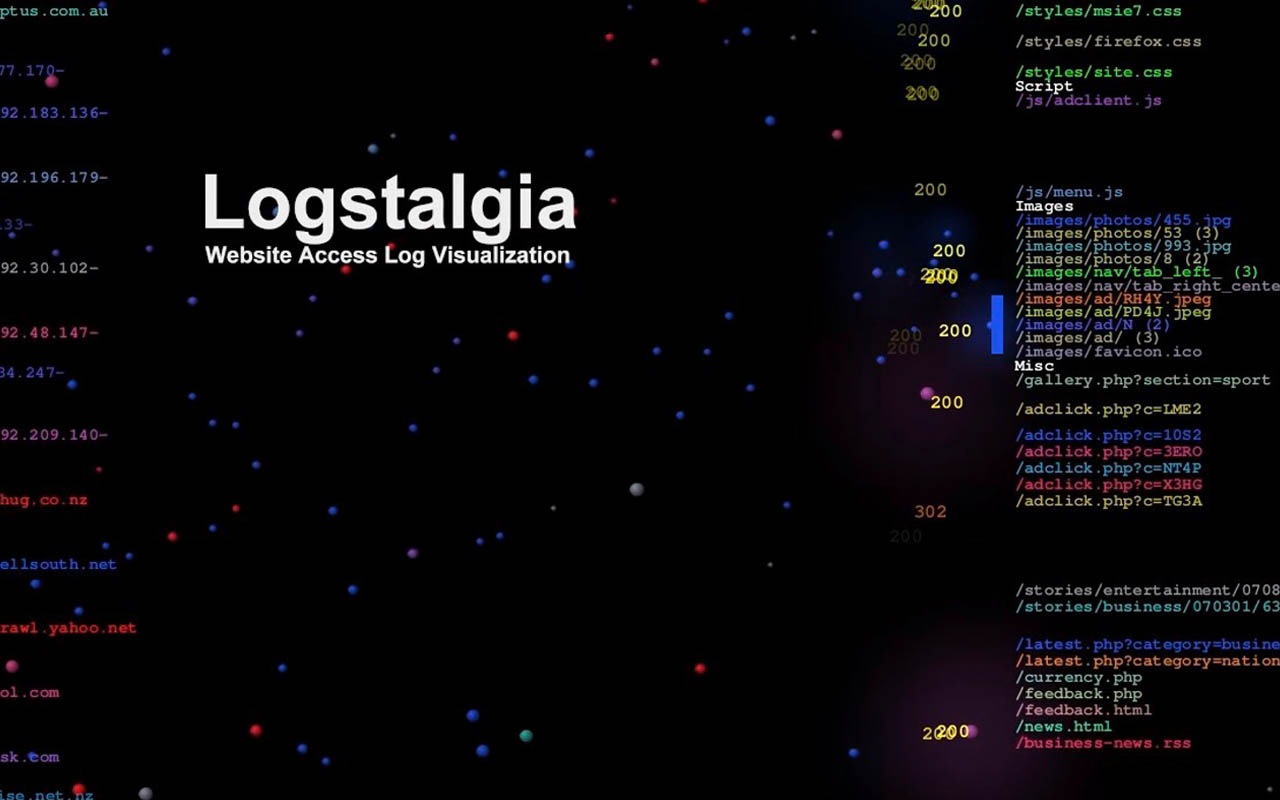


“Logstalgia is a website traffic visualization tool that replays or streams web-server access logs as a pong-like battle between the web server and an never ending torrent of requests.
Requests appear as colored balls (the same color as the host) which travel across the screen to arrive at the requested location. Successful requests are hit by the paddle while unsuccessful ones (eg 404 – File Not Found) are missed and pass through.
The paths of requests are summarized within the available space by identifying common path prefixes. Related paths are grouped together under headings. For instance, by default paths ending in png, gif or jpg are grouped under the heading Images. Paths that don’t match any of the specified groups are lumped together under a Miscellaneous section.”


I am a full-stack developer. My expertise include:
I love programming, design and know my way around server architecture as well. I would never feel complete, with one of these missing.
I have a broad range of interests, that’s why I constantly dive into new technologies and expand my knowledge where ever required. Technologies are evolving fast and I enjoy using the latest.
Apart from that, I am a peace loving guy who tries to have people around him that think the same. I truly believe in the principle: “If you help someone, someone will help you, when you need it."